
W.E.B. Du Bois
William Edward Burghardt Du Bois (1868 to 1963) was a sociologist and historian. He helped co-found the NAACP (National Association for the Advancement of Colored People) and was author of the seminal book, The Souls of Black Folk. He was one of the most important black activists and intellectuals of the 20th century.
The commission
His status was confirmed when, in 1900, Du Bois was invited to create an exhibition for the world fair in Paris – the Exposition Universelle – about the condition of black people in contemporary America.
Du Bois and his sociology students from the University of Alabama were well aware that black people were going to be overwhelmingly portrayed at the world fair as primitives and savages, living in mud huts in Africa and photographed wearing picturesque tribal costumes, with long descriptions of their customs and rites which were all written to underpin and justify continued colonial rule over all of Africa.
So Du Bois and the team set out to refute all the racist stereotypes and slurs of the day by emphasising the solid achievements of Afro-Americans in the forty years since Emancipation.
In less than four months he and his sociology students assembled a display of 63 hand-drawn charts designed to convey solid data and information about the role and position of blacks in 1900 America.
They developed highly inventive visual techniques for conveying a wide variety of information about the experience of black Americans, many of them anticipating the kind of infographics we use now by over a century.
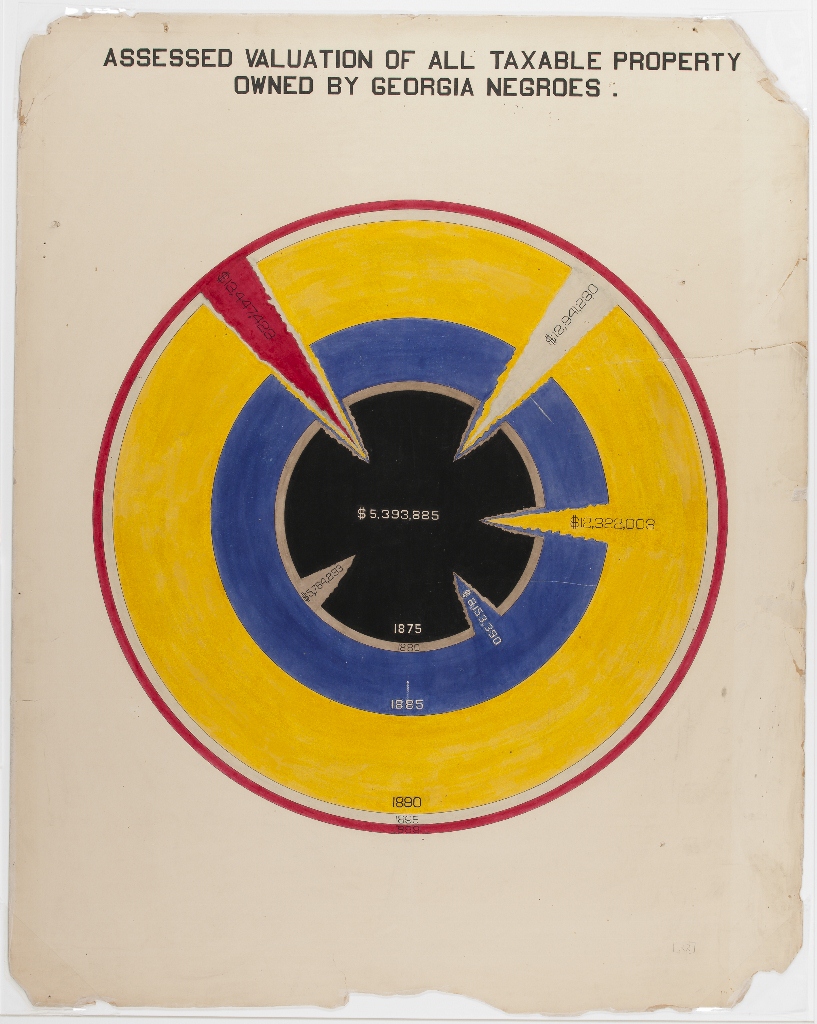
Assessed Valuation of All Taxable Property Owned by Georgia Negroes © WEB Du Bois
The aim of Du Bois and his team was to combat racist stereotypes about black poverty, laziness, lack of initiative, lack of ability in business, disinterest in education and so on, by supplying a wealth of solid statistical evidence to prove the exact contrary.
The charts show how turn-of-the-century Afro-Americans were flourishing in education, buying land, starting businesses and becoming economically independent, despite the full might of institutionalised racism and segregation designed to hold them back.
The charts were divided into two categories – a set about the USA in general, and another set about the situation in the state of Georgia.
Part 1. Black lives in Georgia
In 1900 the state with the largest black population was Georgia, 44% of whose population were African-Americans, making it a statistical test bed for Du Bois and his team. The 36 charts show Georgia’s black population growth, density and age distribution, compared with other states.
They show how wealth, literacy and land ownership had increased since Emancipation and compared how occupations compared with the white population.
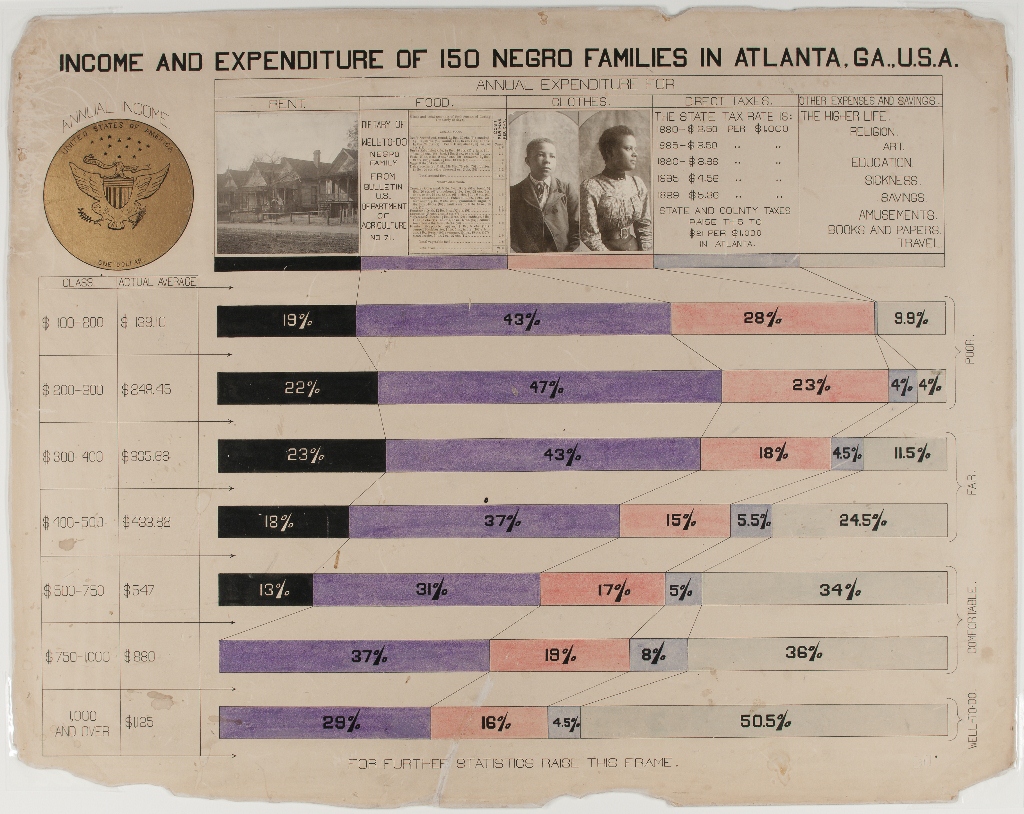
Income and Expenditure of 150 Negro Families in Atlanta, Georgia, USA © WEB Du Bois
Part 2. Black lives in the USA
The second set of charts examined aspects of Afro-American life across the USA.
In 1900 there were around nine million blacks in America, 12% of the population. The charts show achievements by Africa-Americans, but also highlight the ways the community as a whole was being held back by the Jim Crow segregation laws which were to remain in place until the Civil Rights Act of 1964.
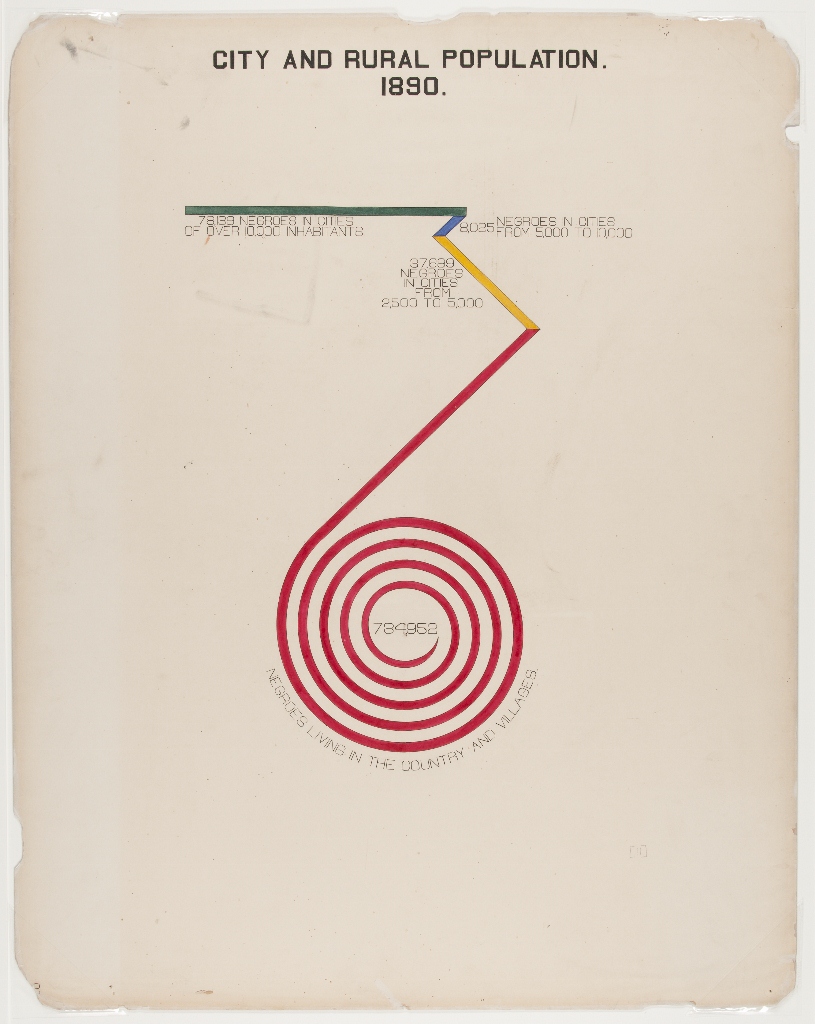
City and Rural Population, 1890 © WEB Du Bois
Infographics
Cool, aren’t they? Part of their appeal is in their variety. As far as I could see, no two of the charts uses the same design and layout.
Each one is attached to a big board attached to the wall and hinged so you can work your way steadily through them. Each one is numbered and has a label which contains the background information about the chart and comments on the design, for example snippets such as the Georgia town of Darien had a large African American population due to its shipping or lumber trades, or the percentage of religious faiths among the black population.
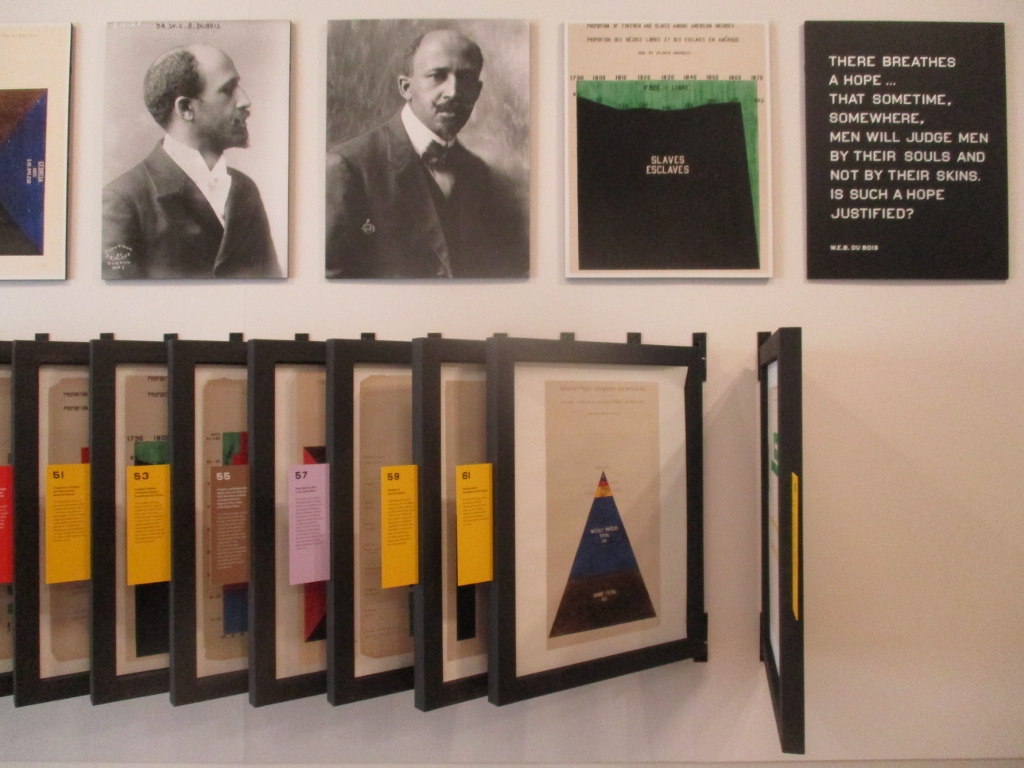
Installation view of W. E. B. Du Bois: Charting Black Lives: Pioneering infographics from turn-of-the-century America at the House of Illustration. Photo by the author
Mona Chalabi
There’s another thread to the exhibition: House of Illustration invited Mona Chalabi who is a New York-based journalist and producer and data editor at The Guardian USA to review Du Bois’s charts and update them.
The result was just four charts in which Chalabi reprises the original designs but with current data, thus showing what has changed in the past 120 years. It’s a mixed story. Her updating of Du Bois’ population chart reveals that the percentage of the US population which is African American has, surprisingly, stayed static – it was 12% in 1900, it is 12% now.
Her update of the literacy chart shows that black illiteracy has fallen to just 1.6%, but current research suggests there is still a gap between white and black literacy because of differences in quality of education.
Her update of the occupations chart shows the most evenness: grouping jobs into five categories shows that black and white Americans now work in similar sectors.
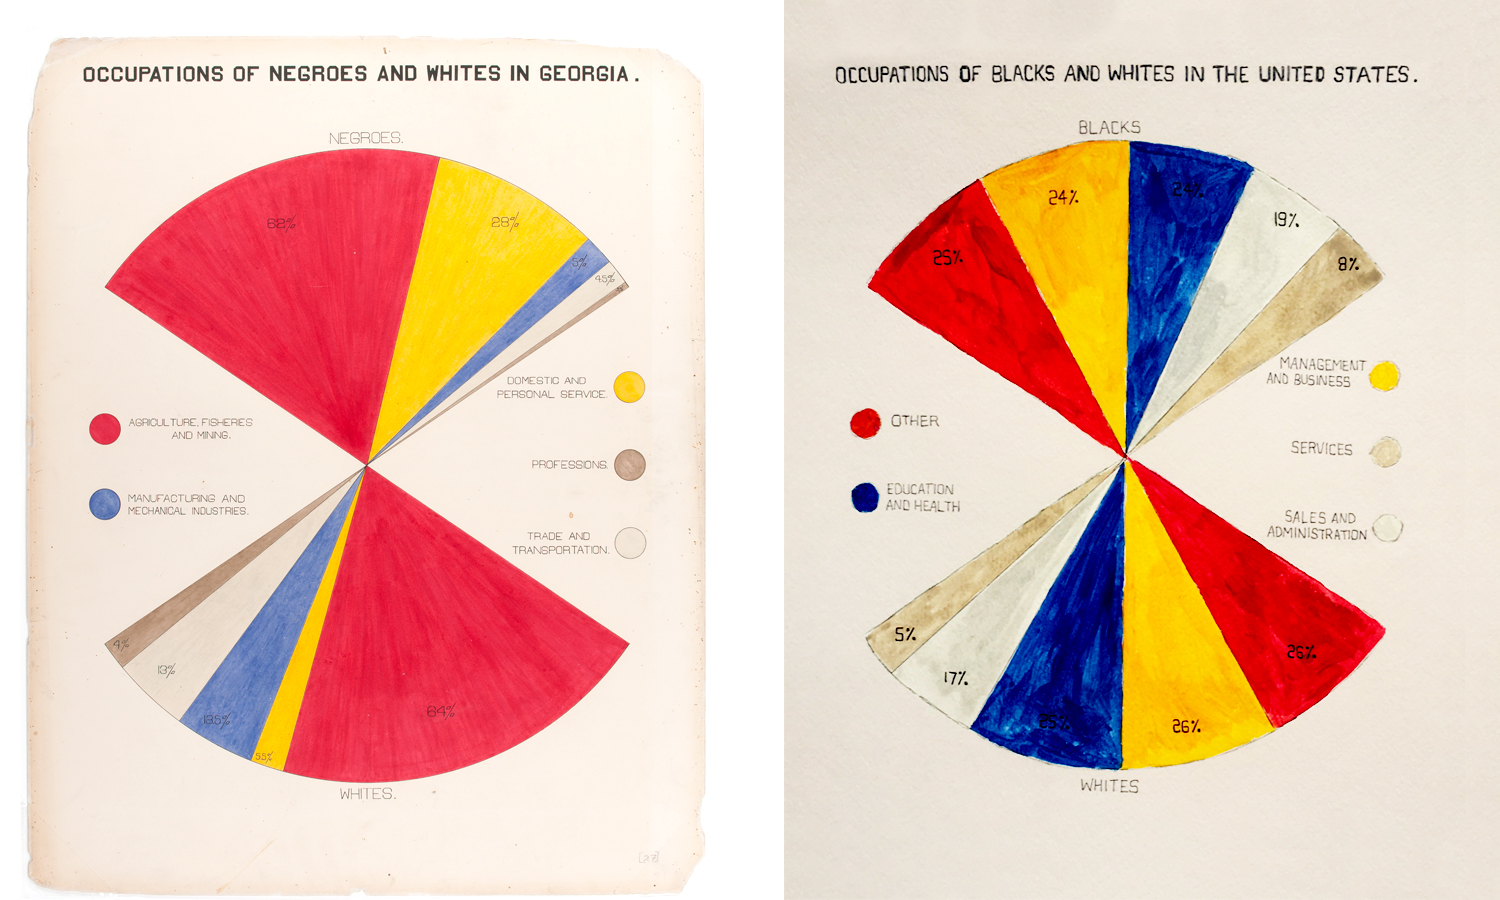
Occupations © W. E. B. Du Bois and Mona Chalabi
Less hopeful is her update of the chart showing the net worth of US households, which suggests that for every dollar in net assets which a black household has, a white household has $16.50 more.
Photos of black folks
So much for the information, then – but there’s yet another strand to the exhibition which, if I’m honest, I found by far the most attractive – and this was a set of contemporary photographs of African Americans from the year 1900.
The original exhibition in Paris contained no fewer than three bound volumes of photographs most of which were taken by photographer Thomas E. Askew, and including some 500 photos. The one public statement Du Bois made concerning these photographs was that visitors to the American Negro exhibit would find ‘several volumes of photographs of typical Negro faces, which hardly square with conventional American ideas.’
The aim, once again, was to utterly refute the racist stereotypes about the poverty, broken homes, alcoholism and shiftlessness of African Americans, and to show them as smartly dressed, well educated, professional people – in other words, as good Edwardian bourgeois.
Intriguing and creative and innovative as the data charts are, it was the little display of nine contemporary photographs which really did it for me – which brought to life the families and communities and real people behind the graphs and spirals and pie charts and statistics. The face of the young woman sitting at the front centre, in particular, has haunted me for days.
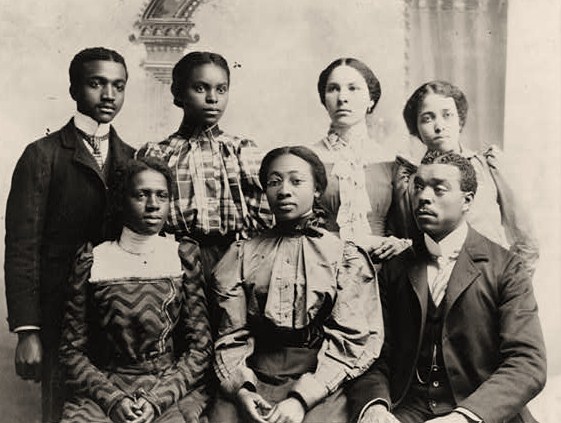
Roger Williams University, Nashville, Tennessee, Normal class 1899
Related links
- W. E. B. Du Bois: Charting Black Lives Pioneering infographics from turn-of-the-century America continues at the House of Illustration until 1 March 2020
- Explanation of the Du Bois exposition material on the Library of Congress website
- All the charts and 220 photos involved in the project on the Library of Congress website
